Veusz – a scientific plotting package
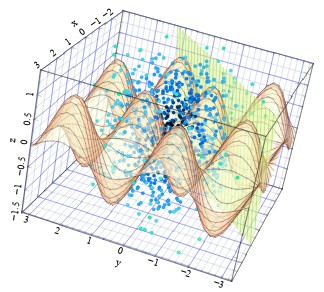
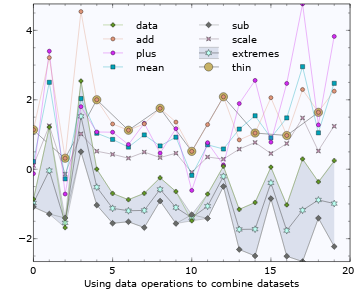
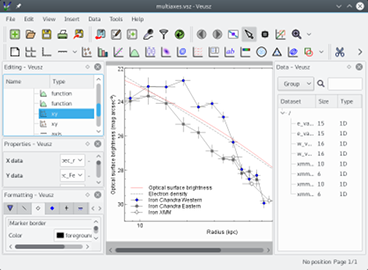
Veusz is a scientific plotting and graphing program with a graphical user interface, designed to produce publication-ready 2D and 3D plots. In addition it can be used as a module in Python for plotting. Veusz is multiplatform, running on Windows, Linux/Unix and macOS. It supports vector and bitmap output, including PDF, Postscript, SVG and EMF. Veusz is Free Software.
With the help of a tutorial the program can be used by the novice user and is flexible for advanced work. In Veusz plots are created by building up plotting widgets with a consistent object-based interface, where the user sets the properties of the widgets. There are many options for customization of plots. See features, 2D examples and 3D examples to see what can be done with the program.
It allows data to be imported from text, CSV, HDF5 and FITS files. Datasets can also be entered within the program and new datasets can be created via the manipulation of existing datasets using mathematical expressions and more. The program can also be extended, by adding plugins supporting importing new data formats, different types of data manipulation or for automating tasks.


